Market Pulse
Downtown Denver Market Pulse
Where the energy is moving.
Downtown Denver isn't one market. It's a collection of neighborhoods, each with its own character, opportunities and challenges. This illustrative map shows our perspective on current real estate momentum across the downtown area.
Market Activity
- Stronger Activity
Higher demand, more investment - Moderate Activity
- Weaker Activity
Softer demand, more challenges
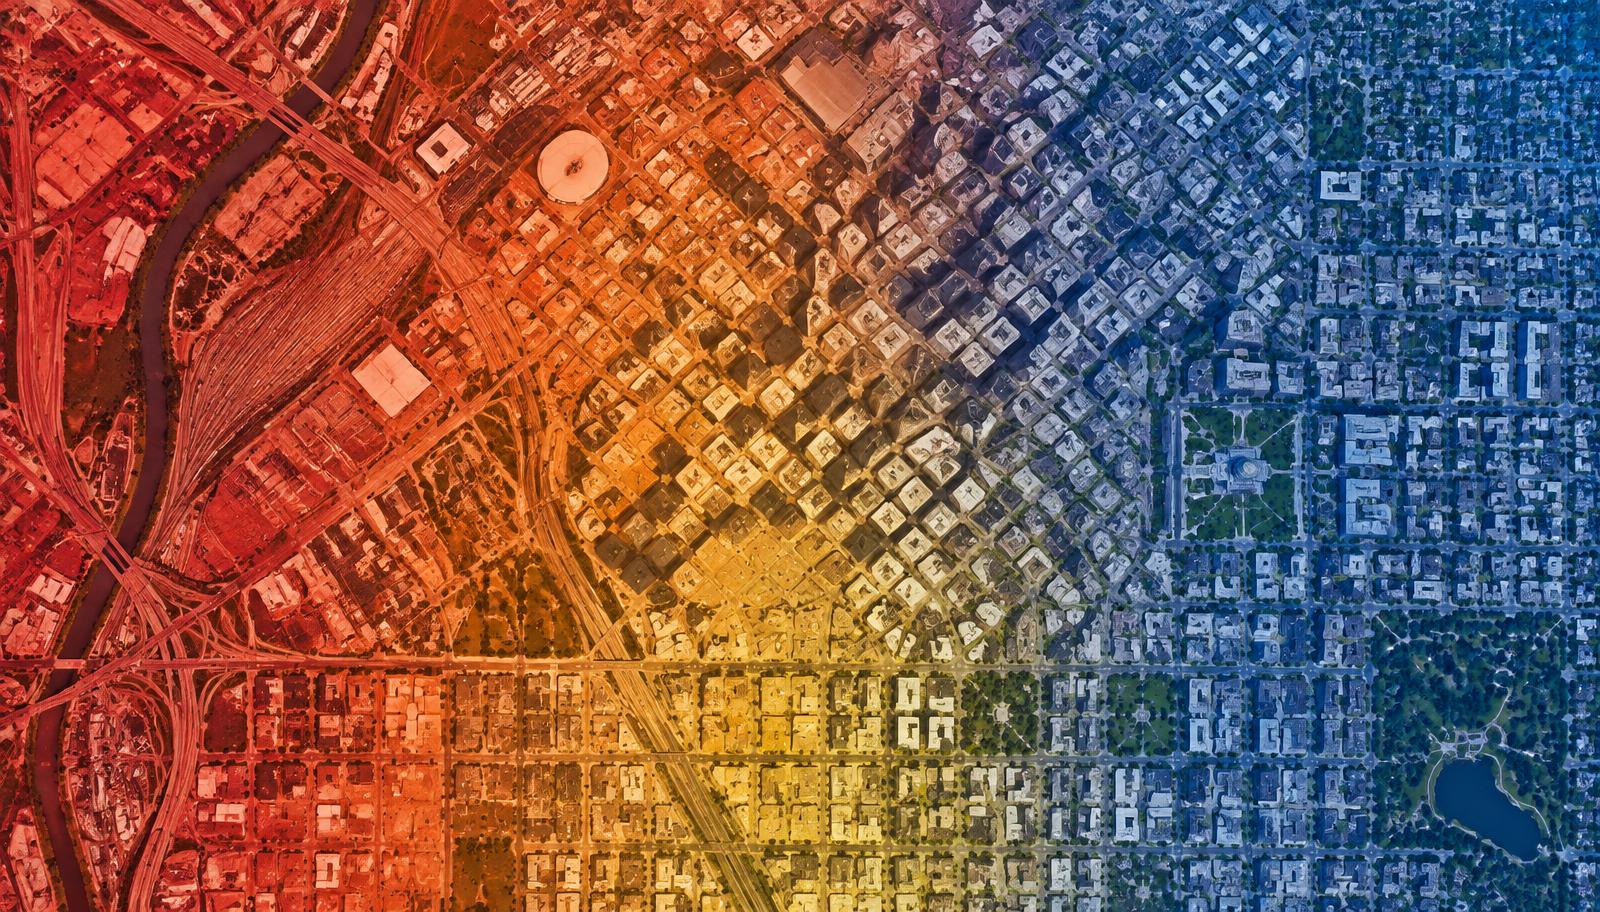 Union StationLoDoLower DowntownBallparkCoors FieldRiNoArts DistrictConvention Center& HospitalityEast of CurtisChallenging Market Conditions
A Strong Western Core
From Speer to Wynkoop to 17th Street, including Union Station, LoDo and Ballpark, continues to show the greatest momentum.
RiNo Building Momentum
Continued investment and new development are driving activity in the RiNo Arts District.
Convention Center Impact
The 14th Street corridor benefits from the Denver Convention Center, hotels and related hospitality investment.
East of Curtis Remains Challenged
From Curtis Street to Broadway, office properties face significant headwinds with elevated vacancy and continued uncertainty.
Illustrative — Jamis market perspective, not measured block-level data.
How Downtown's Center Has Moved
- 01
17th & Welton
The historic center of downtown business activity.
- 02
16th & California
The action shifted when the 16th Street Mall was built.
- 03
16th & Market
Union Station's redevelopment pulled activity toward LoDo.
- 04
Toward 20th Street
Coors Field opened in 1995 and Ballpark took off.
- 05
RiNo
Affordable land and access drove new construction north.
Downtown Denver's center of activity has continually evolved. From the traditional Central Business District to LoDo, Ballpark, and the remarkable emergence of RiNo, each neighborhood has developed its own economic identity. At Jamis Companies, we've witnessed these changes firsthand. That perspective helps us evaluate not only where properties stand today, but the trends that may influence their value tomorrow.
Neighborhood by neighborhood
Test data. The areas, levels and notes below are placeholders while real sources and boundaries are reviewed. Do not rely on them.
Table view
| Neighborhood | Activity | Commentary |
|---|---|---|
| Ballpark | Strong | Sample current commentary. |
| RiNo / River North | Emerging | Sample current commentary. |
| LoDo / Union Station | Active | Sample current commentary. |
| Central Business District | Strong | Sample current commentary. |
| Five Points & Beyond | Emerging | Sample current commentary. |
Method: editorial assessment of neighborhood vitality. Source: Test geometry and sample notes, as of November 6, 2026. Map tiles © OpenFreeMap, OpenStreetMap contributors. Circle positions are approximate and are not boundaries.